
Creating effective presentations can be a daunting task, especially when trying to convey complex processes and data clearly and engagingly. One common stumbling block is the design of visual aids like flow charts. Without the right tools and techniques, these charts can become cluttered and confusing, undermining their purpose to streamline understanding and enhance communication. This is where mastering the art of creating a flow chart in PowerPoint becomes invaluable.
In this blog, we’ll explore not just one, but four simple ways to create a flow chart in PowerPoint that suits your specific needs, whether you’re a novice looking for quick solutions or an experienced presenter aiming for customizability. From using handy SmartArt graphics to drawing shapes manually, and even building interactive flow charts in just a few clicks, you’ll learn step-by-step methods to create clear, visually appealing flow charts. Let’s begin!
Why Use Flow Charts in PowerPoint?
Flow charts are an indispensable tool in both educational and professional settings, serving as visual aids that simplify complex processes and enhance comprehension. Their structured presentation of information helps audiences follow a logical sequence of events, making it easier to understand detailed procedures or workflows.
Here are several compelling reasons to integrate flow charts into your PowerPoint presentations:

🔍 Clarity in Communication
Flow charts transform intricate or lengthy descriptions into straightforward, digestible visuals. By representing steps and decision points with symbols connected by lines, they provide a clear path through complicated processes, reducing the cognitive load on your audience and preventing misunderstandings.
💡 Enhanced Engagement
A well-designed flow chart in PowerPoint can capture the attention of your audience more effectively than text-heavy slides. Visual representations help maintain interest and can make the difference between a compelling presentation and a forgettable one. They also cater to visual learners who might struggle with raw data or bulleted lists.
🛠️ Error Reduction
Using flow charts in planning and analysis phases can help identify potential problems before they arise. By laying out each step of a process, it becomes easier to spot inefficiencies, redundancies, or bottlenecks, allowing for smoother operations and fewer mistakes.
🤔 Decision Making
Flow charts in PowerPoint are particularly useful in decision-making processes. They visually map out the consequences of different choices, guiding stakeholders to make informed decisions by clearly illustrating outcomes and steps.
📏 Standardization
In organizational contexts, flow charts are vital for standardizing procedures. They ensure that everyone understands the process the same way and performs tasks consistently, which is crucial for maintaining quality control across departments and teams.
4 Simple Methods for Creating Flow Charts in PowerPoint
1. Using Native PowerPoint Shapes

Creating a flow chart using native PowerPoint shapes allows for complete customization and adaptability to your specific needs. This method is particularly useful when you need a custom layout that fully represents unique steps and decisions in your process. Here’s how you can create a tailored flow chart:
- Manually insert shapes onto a blank PowerPoint slide. Use different shapes to represent different types of actions or decisions, making your flow chart more understandable and standardized.
- Once the flow is laid out, begin coloring your shapes to make the flow chart visually appealing. Utilize resources like ColorHunt to choose harmonious color combinations that fit your presentation’s theme.
- Connect the shapes with line connectors from the Shapes collection to depict the flow of processes clearly.
2. Using Pre-made PowerPoint SmartArt Graphics

For those seeking efficiency and simplicity, using pre-made SmartArt graphics in PowerPoint is an excellent option. SmartArt allows you to quickly put together a professional-looking flow chart with minimal effort. Here’s how to utilize this tool:
- From the Insert tab, go to SmartArt.
- Choose a graphic from the available collections that best suits your data flow. The Hierarchy collection is typically most suitable for flow charts.
- Customize your flow chart further in the SmartArt Design tab: select your preferred color palette from the Change Colors dropdown, and enhance the visual appeal by choosing a design layout to add texture to your flow chart blocks.
3. Using a Downloadable Flow Chart PowerPoint Template
If you’re looking for a quick start with a polished look, downloadable templates are the way to go. These templates provide a foundational structure that you can customize as needed, saving you time on design and layout. Here’s how to find and use these templates:
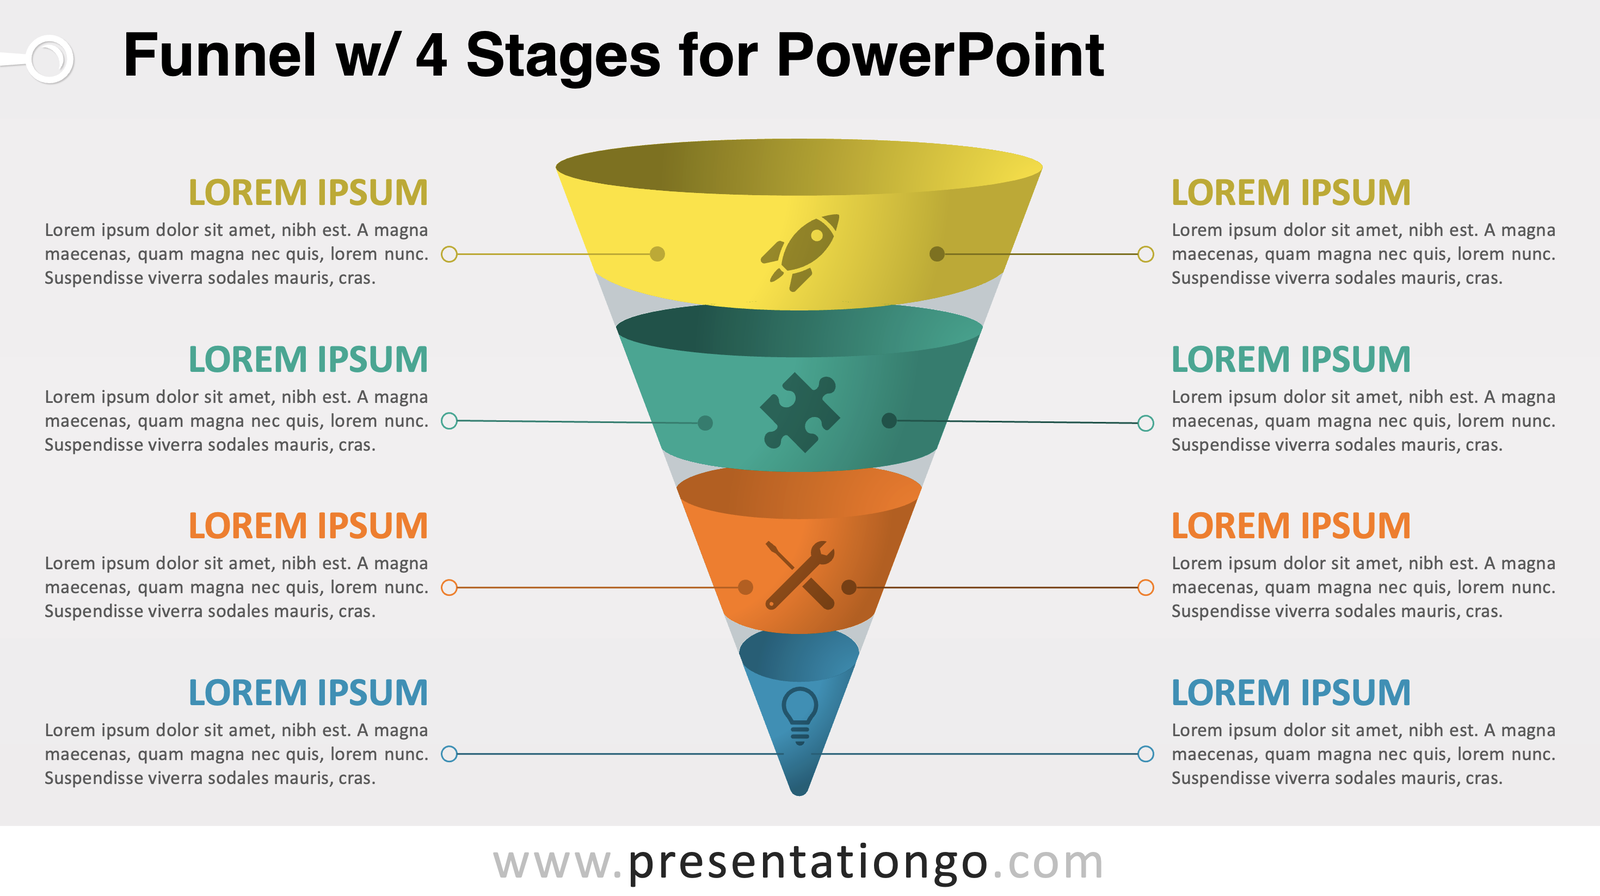
- Visit websites like PresentationGo to find free flow chart PowerPoint templates.
- Search for “flow chart” and choose from a wide array of options to find one that meets your presentation needs.
- Download and open your selected template in PowerPoint, choosing your preferred presentation ratio.
- Customize the template as needed to fit your content and aesthetic preferences, ensuring it aligns with your overall presentation style.
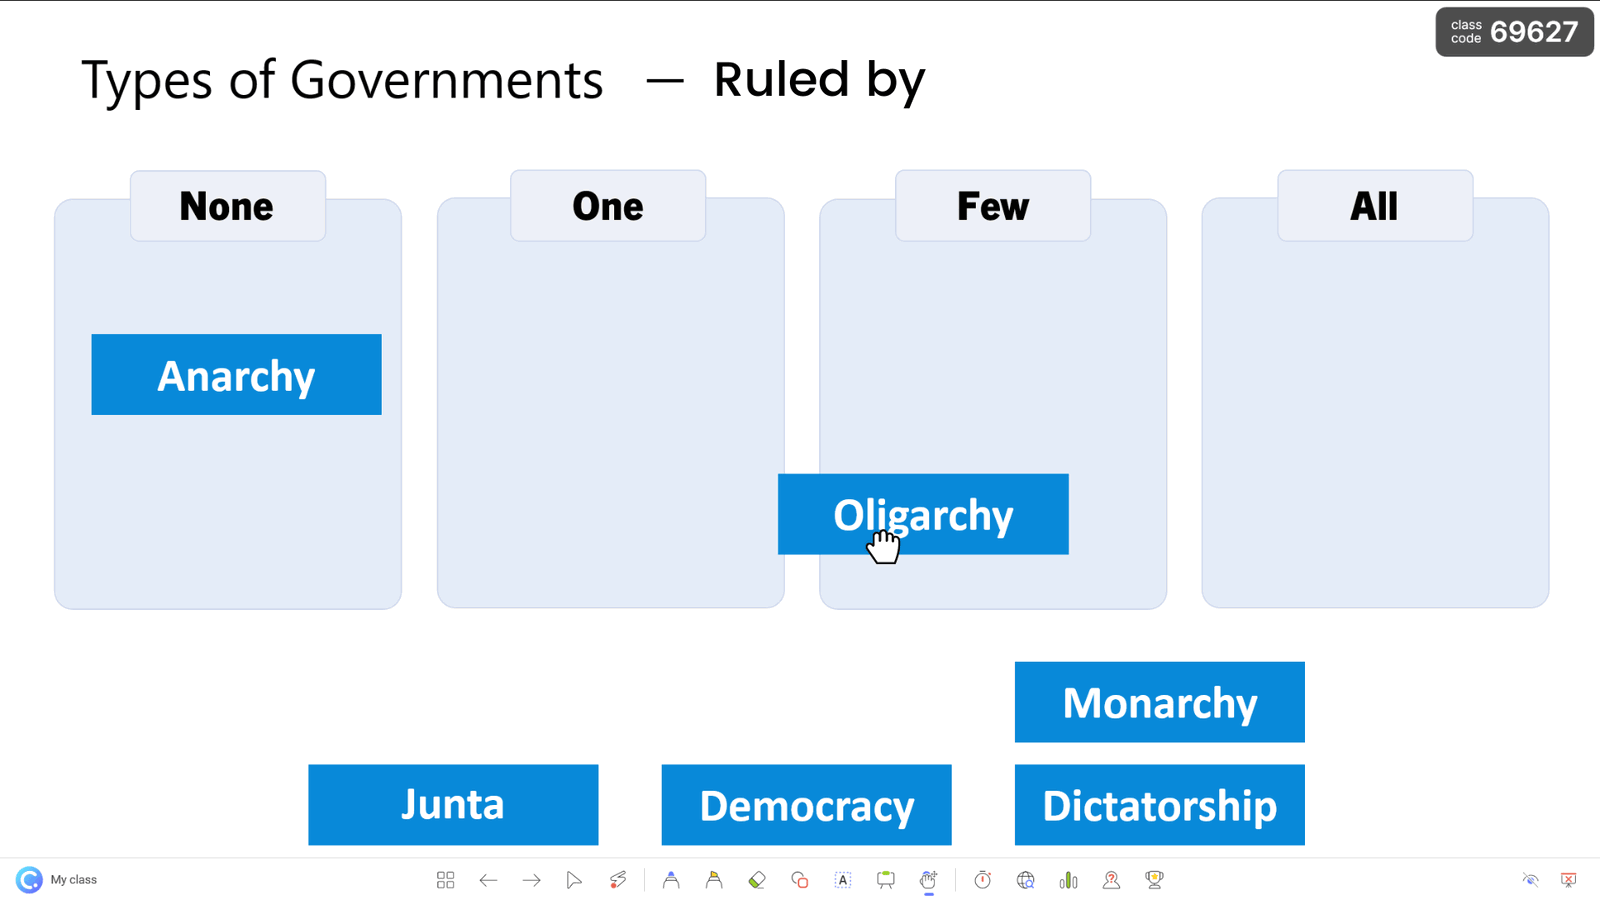
4. Interactive Flow Chart
Easily turn your flow chart in PowerPoint into an interactive experience with ClassPoint’s Draggable Objects. Whether it is to engage with your audience,
- Download ClassPoint.
- Click “Draggable Objects” from your PowerPoint ribbon and select your desired objects to “enable Drag: at the side panel.
- Enter slide show mode and select the hand icon at the bottom toolbar to start dragging!
Explore 8 ways to use Drag and Drop in your presentation. Looking for more ways to make your presentation interactive, download this Ultimate PowerPoint Interactive Playbook!
Technical Tips for Crafting the Perfect Flow Chart in PowerPoint (by the Pros)
Creating an effective flow chart is not just about choosing the right tool or template—it’s about understanding and implementing design principles that enhance clarity and usability. Here are some technical tips and lesser-known facts to help you design flow charts that are not only visually appealing but also functionally superior:
1. Limit Your Blocks
Keep It Simple: Aim to use no more than 7-10 blocks in a single flow chart. Cognitive research suggests that people can only hold about 7 items in their working memory at a time. Exceeding this limit can make your flow chart hard to follow and cluttered, reducing its effectiveness in conveying information.
2. Maintain Flow Direction
Consistency is Key: Whenever possible, maintain a consistent direction in the flow of your chart, typically top-to-bottom or left-to-right. This aligns with how most people scan documents and helps prevent confusion. Avoid mixing directions as it can disorient the reader and complicate the interpretation of data.
3. Use Color Strategically
Highlight, Don’t Overwhelm: Utilize color to highlight critical steps or decision points in your flow chart. However, be cautious not to overdo it. Too many colors can be distracting and counterproductive. Stick to a palette of 3-4 complementary colors to maintain visual coherence and enhance readability.
4. Optimize Line Connectivity
Clarity in Connections: Use elbow connectors instead of straight lines when connecting blocks across different levels. Elbow connectors provide clear, direct paths and avoid crisscrossing, which can make the chart look messy and confusing. This is particularly important in complex diagrams where multiple pathways intersect.
5. Align and Distribute
Professional Precision: Use PowerPoint’s built-in alignment and distribution tools to ensure all of your shapes are evenly spaced and aligned. This not only improves the aesthetic appeal but also promotes easier comprehension by maintaining a structured, orderly layout.
Looking for more PowerPoint templates? Check out our Decision Tree template, Roadmap template and Org Chart template.
6. Use Symbols Consistently
Universal Understanding: Standardize the symbols and shapes used in your flow chart to represent specific types of actions or decisions. For example, rectangles can represent processes, diamonds for decisions, and ovals for start/end points. Consistent use of these symbols helps streamline the learning curve for new viewers and enhances the flow chart’s utility across different contexts.
7. Avoid Overloaded Text
Less is More: Keep text within your flow chart blocks brief and to the point. Overloading blocks with too much text can make them difficult to read at a glance. Use keywords or short phrases and consider accompanying documentation for detailed descriptions if needed.
8. Test Readability
Feedback Loop: Before finalizing your flow chart in PowerPoint, test its readability with a small group from your target audience. Getting feedback can uncover issues that you may not have noticed, such as confusing pathways or unclear symbols, and allow you to refine the chart before it’s presented more broadly.
Aside from these technical tips, you may also want to check out our rundown on hidden PowerPoint tips & tricks to help you on your next presentation.
Additional Takeaway
Adopting the right approach to creating flow charts in PowerPoint can significantly enhance the effectiveness of your presentations. Beyond the basic functionality, mastering the subtle art of visual storytelling can transform a simple flow chart in PowerPoint into a compelling narrative tool.
Furthermore, the evolution of your presentation skills should also consider the integration of interactivity and multimedia elements, which PowerPoint supports robustly. For instance, embedding hyperlinks within your flow chart or using animations can make your diagrams more dynamic and engaging. This interactive layer invites the audience to participate actively in the flow of information, turning passive viewers into active participants. Such enhancements not only enrich the viewer’s experience but also deepen their understanding of the material, paving the way for more impactful presentations.
Embrace these techniques to elevate your presentations from informative to unforgettable, ensuring your ideas flow as smoothly as your expertly crafted flow charts.
